

.webp)

1 min read
Beyond 360 degree feedback: Why HR leaders need system intelligence
 Mathan Allington
If you're researching 360 degree feedback software, you already know the basics. Multiple raters assess an individual. Anonymous surveys collect...
24 min read
 Mathan Allington
Updated on August 27, 2026
Mathan Allington
Updated on August 27, 2026
Last reviewed August 2026
This page collects the HR, talent acquisition, engagement, culture and learning statistics worth citing in 2026, with every figure traced back to the organisation that produced it. Where a widely repeated number turned out to have no source, we have said so rather than passing it on.
One finding shapes most of the others. Across Australia, people have stopped moving. Job mobility has fallen four years running, recruitment difficulty is at a series low, and average turnover is down. At the same time, employers still cannot fill roughly a third of the vacancies they advertise. Fewer people are moving, and the ones who do move are harder to place well. That combination raises the cost of every individual hiring and development decision you make.
5.2
suitable applicants per vacancy in Australia, from 21.5 who apply
Jobs and Skills Australia, Mar qtr 2026
68.2%
of Australian vacancies get filled
Jobs and Skills Australia, Mar qtr 2026
7.2%
of Australians changed employer, a fourth straight fall
ABS, year to February 2026
20%
of employees worldwide are engaged at work
Gallup, 2026
22%
of managers are engaged, down from 31% in 2022
Gallup, 2026
244
applications per job, more than double 2022
Greenhouse, 2025
On this page
Hiring and shortlisting in 2026Employee engagement statisticsWorkplace culture benchmarksTalent management: mobility, turnover and retentionAI in hiring: adoption, evidence and candidate reactionAI, skills and the shape of workWhat actually predicts job performanceLearning and development statisticsHR technology and applicant tracking systemsUnited Kingdom, United States and Asia PacificQuick reference: more verified numbersStatistics that get repeated but do not hold upHow we checked these numbersSourcesEvery statistic below names its source, its sample and the period it covers. Quote it with that attribution attached, because a number without a date and a population behind it is not evidence.
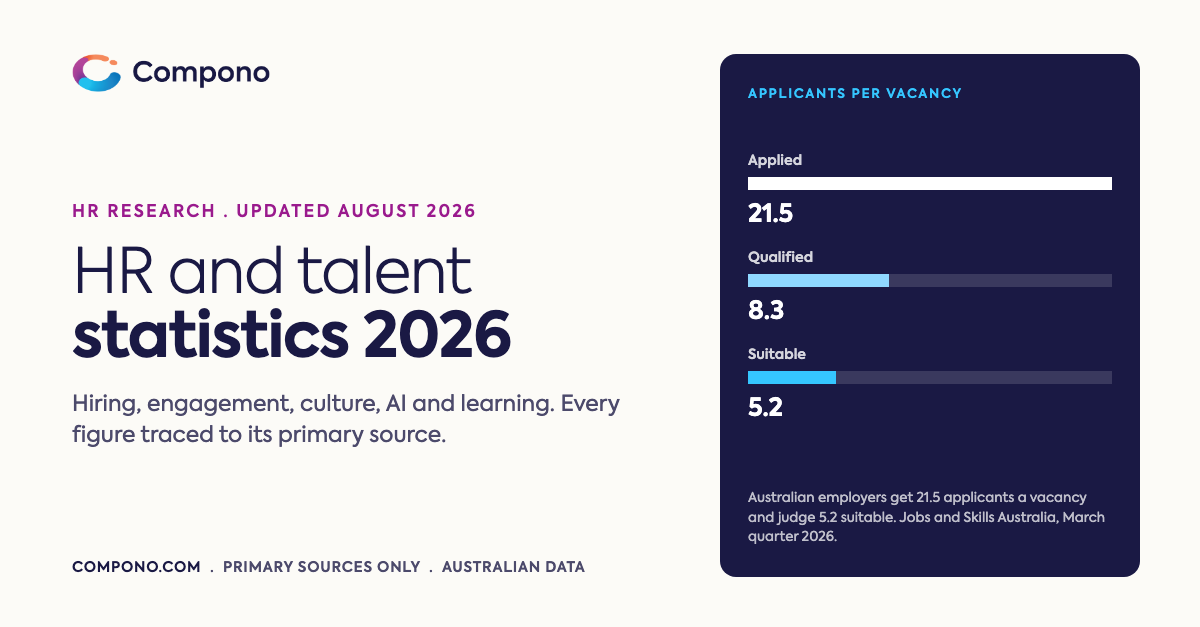
Australian employers are receiving fewer applicants per vacancy than two years ago, and still filling fewer roles. The Jobs and Skills Australia survey asks recruiting employers how many people applied, how many were qualified, and how many were actually suitable. The gap between those three numbers is the whole problem.
Australian applicants per vacancy, March quarter 2026
Roughly three in four people who apply are not qualified for the role, and a further third of those who are qualified are judged unsuitable.
Source: Jobs and Skills Australia, Survey of Employers who have Recently Advertised (SERA), March quarter 2026
Suitable applicants per vacancy have actually improved, from 3.2 in the March quarter of 2024 to 5.2 two years later. The fill rate has not followed. It peaked at 72.1% and has fallen back to 68.2%, so close to a third of advertised Australian vacancies still go unfilled.
Australian vacancy fill rate, quarterly
Selected quarters from a nine-quarter series. The peak was 72.1% in the June quarter of 2025.
Source: Jobs and Skills Australia, Survey of Employers who have Recently Advertised (SERA), March quarter 2026
Outside Australia the picture looks different, and the reason is that most global benchmarks measure applications through an applicant tracking system rather than surveying employers. Greenhouse, working from 640 million applications across more than 6,000 companies, recorded applications per job rising from 116 in 2022 to 244 in 2025 while the number of recruiters per organisation more than halved.
Applications per job against recruiters per organisation
Applications handled per recruiter went from 146 to 746 over the same period. These are two different scales shown as two charts rather than one, because a shared axis would misrepresent both.
Source: Greenhouse, 2025 recruiting benchmarks (6,000+ companies, 640 million applications)
In Australia, SEEK reported applications per job ad at their highest level on record in July 2026, after seven consecutive monthly increases, while job ads themselves fell 6.0% year on year. More people are applying for fewer roles, and employers still report that only a quarter of them are suitable. That is a shortlisting and matching problem, not a sourcing one.
Global engagement fell to 20% in 2025, the lowest Gallup has recorded since 2020 and the first back-to-back annual decline in the series. The interesting part is who accounts for the fall.
Manager engagement against everyone else
Manager engagement fell nine points in three years. Over the same period non-manager engagement moved from 20% to 19%. The global engagement decline is almost entirely a management story.
Source: Gallup, State of the Global Workplace 2026 (141,444 employed respondents, 140+ countries)
That matters because managers are the mechanism organisations rely on to deliver everything else. Retention, culture, performance and development all run through the same layer that is currently degrading fastest.
US$10 trillion
Gallup's modelled estimate of what low engagement costs the world economy each year, equivalent to 9% of global GDP. This is a model built on engagement data, not a measured loss, and should be quoted that way.
Share of employees engaged at work, by region
Half the global average, and below the European average
Source: Gallup, State of the Global Workplace 2026 (141,444 employed respondents, 140+ countries)
Australia and New Zealand sit almost exactly on the global average for engagement. On wellbeing the region looks completely different: 55% of workers are thriving, second highest in the world. People here are living good lives and having ordinary workdays.
The Australia and New Zealand gap: thriving against engaged
Half of Australian workers also reported a lot of stress the previous day, against a global average of 40%.
Source: Gallup, State of the Global Workplace 2026 (141,444 employed respondents, 140+ countries)
Culture stopped being a soft agenda item in 2026 and became an AI readiness question. Deloitte's global human capital research found 65% of organisations believe their culture needs significant change because of AI, and 34% say culture is actively inhibiting their AI goals.
The gap between what leaders want from culture and what they have built
One in three surveyed workers went through 15 or more major changes in a single year.
Source: Deloitte, 2026 Global Human Capital Trends
The clearest evidence that reading your people correctly is worth something comes from SHRM. Workers who say their organisation effectively addresses workplace needs report 91% job satisfaction. Where workers say it does not, satisfaction is 44%.
Job satisfaction, by whether the organisation reads its people well
A 47 point spread, driven by whether the employer understands what its people actually need.
Source: SHRM, State of the Workplace 2026
Qualtrics, surveying 33,831 employees across 24 countries, found engagement among new hires down seven points to 65%, the sharpest fall of any group. New hires' sense that they could challenge the status quo dropped from 64% to 50% in a year.
The onboarding window is where culture either takes or fails, and it is deteriorating faster than anywhere else in the employee lifecycle. Measuring it is the job of a culture and engagement platform, and definitions for the terms used on this page are in the HR glossary.
Australians have stopped changing jobs. Job mobility has fallen four years running, to 7.2% in the year to February 2026, the lowest in the current series.
Share of employed Australians who changed employer, year to February
Roughly one million people changed employer. Under-25s move about ten times as often as over-65s: 12.0% against 1.2%.
Source: Australian Bureau of Statistics, Job Mobility, February 2026
Employer-reported data agrees. Average Australian turnover was 14% for the twelve months to December 2025, and the share of organisations running turnover above 20% fell to 23%, the lowest AHRI has recorded since it began measuring in May 2023. Recruitment difficulty fell to 25% of recruiting employers, also a series low.
Australian employers reporting recruitment difficulty
Source: Australian HR Institute, Quarterly Australian Work Outlook, March quarter 2026 (n=612)
56%
of employed Australians have been with their current employer less than five years, and one in ten have been there twenty years or more.
The most uncomfortable Australian finding in this year's data is that deliberate exclusion is rising even as hiring gets easier. Almost seven in ten Australian employers report actively excluding people with certain characteristics when recruiting.
Australian employers who exclude candidates by characteristic
33% in 2024
29% in 2024
18% in 2024
19% in 2024
13% in 2024
11% in 2024
Every category has risen since 2024. Nearly one in five Australian employers will screen out a candidate for being over 55, and the same share for disclosing a disability. These are screening rules, which means they are choices that can be examined and changed.
Source: Australian HR Institute, Quarterly Australian Work Outlook, March quarter 2026 (n=612)
This is where the gap between what gets said about AI and what gets measured is widest. Adoption is lower than the discourse implies, the benefits being reported are almost entirely about speed, and nobody has published credible evidence that AI improves who gets hired.
Reported benefits of AI in HR
Almost nine in ten report efficiency. Fewer than one in four report that it helps them find better people. AI in hiring is currently buying speed, not judgement.
Source: SHRM, State of AI in HR 2026 (n=1,908)
That split is worth sitting with. Speed is a process problem, and process problems are what most HR technology already solves. Working out who will actually do well in the role is a different problem, and it is the one the tooling is not yet touching.
56%
of HR functions using AI in hiring do not measure its impact at all. We could not find a single credible study showing AI measurably reduces time to hire or improves quality of hire. That absence is itself the finding.
Confidence in AI-assisted hiring
An eightfold gap in confidence between the people running the process and the people going through it.
Source: Greenhouse, AI in hiring research, November 2025 (n=4,136 across four countries)
The candidate objection is more specific than a general dislike of the technology. Only about one in five candidates want less AI in hiring overall. What they object to is being assessed without being told, and being left with no reply.
What happened after candidates completed an AI interview
38% of candidates have abandoned a hiring process because it included an AI interview, and a further 12% say they would. The most cited reason for walking was a pre-recorded video scored by AI with no human involved.
Source: Greenhouse, candidate experience research, April 2026 (n=2,950, sample includes Australia)
Widely repeated
One in four candidate profiles worldwide will be fake by 2028.
What the evidence says
That is a Gartner projection, not a measurement.
The forecast is real and Gartner published it. What almost never travels with it is the measured figure from the same release: of 3,000 candidates surveyed in the second quarter of 2025, 6% admitted to interview fraud. A projection three years out and a measured 6% are different kinds of claim, and quoting the first without the second overstates what is known.
In Australia, the Australian Public Service Commission's principles for agency use of AI in recruitment took effect on 1 June 2026. Two provisions matter beyond the public service, because they are a reasonable statement of where the standard is heading: AI tools must not make the final decision in recruitment outcomes, and all recruitment and employment decisions must be explainable and defensible.
Internationally the picture is less tidy. Several jurisdictions have delayed rather than advanced their obligations, with the EU's high-risk employment provisions and Colorado's AI Act both pushed back during 2026. Anyone planning compliance work on the original dates should recheck them.
The headline claim of the last three years has been that skills are churning faster every year. The World Economic Forum's own measure says the opposite.
Share of workers' core skills expected to change
The 39% figure gets quoted constantly. The trend it sits in almost never does. Note also that the report is biennial, so there is no 2026 edition; the next is due in 2027.
Source: World Economic Forum, Future of Jobs Report (2020, 2023 and 2025 editions)
In the United States, Stanford's Digital Economy Lab found a widening employment gap for 22 to 25 year olds in AI-exposed occupations, rising from 15% to 19%. In Australia, the federal department responsible for employment looked for the same effect and did not find it.
Australian employment growth by AI exposure, November 2022 to February 2026
Most-exposed occupations grew more slowly, but they grew. Software and applications programmers rose 25%. Australian graduate unemployment is 5.4%, lower than at any point in the five years before COVID. The department's own wording on the US entry-level finding is that they do not see it in the Australian data.
Source: Department of Employment and Workplace Relations, July 2026
Australian employers report the same thing from the other direction. In AHRI's December quarter survey, 41% of organisations said AI had led to an increase in entry-level roles, against 19% reporting a decrease.
Self-reported productivity gains from AI are large and consistent. Measured gains are neither. In a randomised trial of experienced open-source developers, METR found that using AI tools made them about 19% slower, while the same developers believed they had been roughly 20% faster. They misjudged their own productivity by around 40 percentage points.
That does not mean AI has no value. It means self-report is not evidence of it, and any business case built on people saying they feel faster is built on sand.
AI skills in Australian job ads
Overall AI-skill mentions are still growing but decelerating hard, from 88% annual growth in January 2026 to 60% in July. New Zealand runs ahead of Australia on AI skill demand, at 3.7% of job ads against 2.1%.
Source: SEEK, July 2026
The most quoted table in hiring is out of date. For twenty-five years, selection practice leaned on Schmidt and Hunter’s 1998 meta-analysis. In 2023, Sackett, Zhang, Berry and Lievens rebuilt the estimates and most of them came down, some sharply, and the order changed.
The correction was not a mistake in the maths. It was a mistake in what the maths was applied to. Around four in five validity studies are concurrent (existing employees tested at a point in time), but the range-restriction corrections being used had been derived from predictive studies (applicants tested, then followed). Applying one to the other inflated the results.
Read the table below as evidence about how to assess, not as a leaderboard to pick a winner from. The highest figure in it is 0.42, which still leaves most of job performance unexplained by that method on its own. The useful findings are about the gap between structured and unstructured judgement, and about how little any single signal carries.
Operational validity of selection methods, 1998 estimates against the 2023 correction
| Selection method | 1998 | 2023 | What changed |
|---|---|---|---|
| Structured interview | .51 | 0.42 | Highest in the revised table |
| Job knowledge tests | .48 | 0.40 | Fell in the correction |
| Empirically keyed biodata | .35 | 0.38 | Rose in the correction |
| Work sample tests | .54 | 0.33 | Fell in the correction |
| Cognitive ability (GMA) | .51 | 0.31 | Fell from first to fifth |
| Integrity tests | .41 | 0.31 | Fell in the correction |
| Assessment centres | .37 | 0.29 | Fell in the correction |
| Interests | .10 | 0.24 | Rose in the correction |
| Conscientiousness | .31 | 0.21 | Fell in the correction |
| Unstructured interview | .38 | 0.19 | Fell in the correction |
| Job experience (years) | .18 | 0.07 | Barely better than chance |
Every figure is a mean across many studies and the spread is wide, so treat them as evidence about method quality rather than as promises. and the spread is wide. Structured interviews average 0.42 with an 80% credibility interval of 0.18 to 0.66, so how well you run the interview matters as much as choosing to run one.
Source: Sackett, Zhang, Berry and Lievens (2023), Industrial and Organizational Psychology 16(3), Table 1. Compared with Schmidt and Hunter (1998). Higher is better; 1.00 would be perfect prediction.
Structure is the whole game. A structured interview scores 0.42. The same conversation held without structure scores 0.19, and the bottom of its credibility interval is minus 0.01. An unstructured interview can predict nothing at all, and it is still the most common way people get hired.
No single method carries a hire. Even the strongest predictor in the table explains a minority of what happens after someone starts. That is an argument for combining evidence and knowing what each signal is worth, rather than searching for one method that settles it.
Years of experience barely predicts anything. At 0.07 it is close to useless as a screen, which is awkward given how many job ads still lead with it.
The old rankings are unreliable. Cognitive ability fell from 0.51 to 0.31, and to 0.23 when Griebe and colleagues restricted the analysis to 21st-century studies. Empirically keyed biodata and candidate interests went up. Anyone still designing a process around the 1998 order is working from numbers that have since been revised.
Australian employers spent an average of A$1,122 per employee on training in 2025 and trained 38% of their workforce. Fifteen per cent of Australian organisations have no training budget at all. Spending intent has climbed for three years, from 37% of employers planning an increase in 2024 to 60% in 2026.
Australian employees judged not fully proficient in their role
Australian skills gaps are closing, not widening. Most commentary assumes the opposite direction.
Source: Australian HR Institute, Quarterly Australian Work Outlook, March quarter 2026 (n=612)
The training spend gap by employer size is wide: A$549 per employee at small employers against A$1,547 at large ones. And while 79% of Australian organisations have a training plan and 65% have a strategic workforce plan, only 20% say the two are integrated to any great extent. Joining capability data to workforce planning is what a learning platform should do, and mostly does not.
In the United States, spend per learner rose to US$874 from US$774, while training hours per employee fell from 47 to 40. Employers are paying more for less of people's time.
Corporate learning priorities
Compliance has dropped off the top of the learning agenda for the first time in more than a decade. One in four learning teams took a budget cut this year.
Source: Fosway Group, Digital Learning Realities 2026 (n=334)
The largest capability gap in the region is AI itself. Across more than 7,000 Australian and New Zealand respondents, 60% use AI regularly at work and 78% have had no formal training in how to use it. Lack of training is the second largest barrier to adoption.
Australia and New Zealand: AI use against AI training
6 in 10 use AI regularly at work
Source: Hays, Salary Guide FY26/27 (7,000+ respondents)
Almost 8 in 10 of those users have had no formal AI training
Source: Hays, Salary Guide FY26/27
Non-trade apprenticeship and traineeship contracts in training have fallen 43.8% since 2021, from 130,730 to 73,475, while trade contracts fell only 3.6%. The trade shortage story gets reported constantly. The collapse of the non-trade half of the system does not.
HR technology budgets are tightening. The share of organisations planning to increase HR tech spend has fallen from a five-year high of 47% to fewer than one in three.
Organisations planning to increase HR technology spend
Same question, same survey, each year. The 2026 point sits behind a paywall and is quoted from secondary coverage, so treat it as indicative.
Source: Sapient Insights Group, Annual HR Systems Survey (27th and 28th editions)
Average number of HR system integrations maintained
Per-employee HR technology cost runs the other way. Small employers pay US$324 to US$542 per employee per year, against US$186 to US$221 at enterprise scale.
Source: Sapient Insights Group, Annual HR Systems Survey (27th and 28th editions)
On AI inside HR software specifically, the gap between what vendors ship and what customers use is stark. Awareness of embedded AI in the core HR system moved from 14% to 15% in a year, roughly a quarter of buyers do not know whether their system has AI at all, and only 4% of organisations report using AI agents in HR.
One more counterweight to the forecasts that AI is about to shrink HR. The HR-to-employee ratio has risen from 1.58 per 100 employees in 2017 to 1.98 in 2025, and HR's share of operating expense has doubled from 1.2% to 2.4%. HR has been growing, not shrinking. If you are weighing systems on the back of these numbers, our platform comparisons set out where each of the major vendors fits.
The Employment Rights Act 2025 is rolling out in phases, with the unfair dismissal qualifying period dropping to six months from 1 January 2027. Two credible sources disagree sharply about its effect: the government's own impact assessment puts the cost at around £1 billion a year and no more than a 0.1% increase in total employment costs, while CIPD's survey of 2,082 employers found 74% expecting costs to rise and 37% planning to cut permanent recruitment. Both are worth knowing.
US job satisfaction
A sixteenth consecutive annual rise, and a record. It sits oddly beside the engagement data, which is a reminder that satisfaction and engagement are not the same measure.
Source: The Conference Board, 2026
Additional figures from the same research, grouped by topic. Each one carries the organisation that produced it so you can attribute it correctly.
Checking every figure on this page meant tracing a lot of famous numbers back to their source. Some of them do not have one. These are the ones we found circulating most widely without anything underneath them, and we have left them off the page above.
This matters more than it used to. Unsourced figures are now being ingested and repeated by AI assistants, which launders them one more time and puts them in front of people making real decisions.
Widely repeated
A bad hire costs 30% of the employee’s first-year salary, according to the US Department of Labor.
What the evidence says
No such Department of Labor publication exists.
This is probably the most repeated number in recruitment. We could not find it in any Department of Labor or Bureau of Labor Statistics publication, and no secondary source that quotes it links to one. The citations run in a circle. Treat it as an industry rule of thumb that acquired a government badge through repetition.
Widely repeated
75% of CVs are rejected by an applicant tracking system before a human sees them.
What the evidence says
The trail ends at a resume vendor that shut down in 2013.
Every version of this traces back to Preptel, a resume-optimisation company that promoted the figure around 2012 and closed in August 2013 without publishing a study, a dataset or a method. The number is also unstable, appearing as 70%, 75% and 88% depending on who is retelling it, which is not how a measured statistic behaves.
There is a real 75% here, and it says something different. Harvard Business School and Accenture surveyed 2,275 executives and found 75% of US employers use an applicant tracking system. It was never a rejection rate.
Widely repeated
88% of employers say qualified candidates are rejected by their software.
What the evidence says
Real research, different finding.
Harvard Business School and Accenture did find that 88% of employers believe qualified high-skills candidates get vetted out because they do not match the exact criteria in the job description, rising to 94% for middle-skills roles. That is an employer’s opinion about their whole hiring process, not a measurement of software auto-rejecting anyone.
Real automatic rejection does happen, on rules people configure. In the same study, close to half of employers screened out any CV showing an employment gap of more than six months. That is a policy decision, not a robot.
Widely repeated
Replacing an employee costs one-half to two times their annual salary (Gallup), or 50% to 200% (SHRM).
What the evidence says
One 2019 sentence, no method, and the SHRM attribution is wrong.
Gallup did publish the half-to-two-times range, in March 2019, and cites no study or methodology for it anywhere in the article. The widely seen SHRM version is the same Gallup line wearing a different badge. The related claim that US businesses lose a trillion dollars a year to voluntary turnover is arithmetic performed on that same uncited multiplier.
Widely repeated
Return-to-office mandates increased turnover 20% for women and 7% for men.
What the evidence says
Those numbers are not in the paper.
The University of Pittsburgh study behind this reports the effect on women’s turnover as roughly three times the effect on men’s. The 20/7 split circulates widely in trade press but does not appear in the paper. The headline finding is sound: turnover at firms imposing mandates rose by roughly 13 to 14%, time to fill rose 23%, and there was no significant change in financial performance or firm value.
Widely repeated
Internal mobility grew 11% year on year, and companies that promote internally see 41% lower turnover.
What the evidence says
Attributed to a LinkedIn report we could not find.
Both figures are credited to a LinkedIn internal mobility report that does not appear on any LinkedIn property we could reach. Until someone produces it, these should not be quoted.
Widely repeated
Referrals are 6% of applications but 37% of hires.
What the evidence says
Two contradictory versions, neither sourced.
The same claim also circulates as 2% of applicants and 11% of hires. A threefold disagreement about the same measurement is a sign that nobody is measuring it. We found no primary source for either, so this page carries no referral share figure.
Widely repeated
The World Economic Forum’s Future of Jobs Report 2026 says…
What the evidence says
There is no 2026 edition.
The Future of Jobs Report is biennial. The 2025 edition is current and the next is due in 2027. Anything presented as a 2026 edition is a listicle recycling 2025 figures with the year changed.
Widely repeated
Skills have a half-life of about five years.
What the evidence says
No published method or sample.
The skill half-life idea traces to a corporate blog post and conference commentary with no study underneath it. If you need a defensible number for skill change, the Forum’s measure is that 39% of workers’ core skills are expected to change by 2030, and that figure is falling, not rising.
Widely repeated
AHRI’s June quarter 2026 report found turnover at 13.5% and 19% of employees highly engaged.
What the evidence says
This report does not exist, and AHRI does not measure engagement.
We found this circulating in AI-generated summaries. AHRI has published no June quarter 2026 Work Outlook, and employee engagement is not something the Work Outlook measures at all. The most recent verified AHRI figure is 14% average turnover for the twelve months to December 2025, from the March quarter 2026 report.
Every figure on this page was traced to the organisation that produced it, and read on that organisation's own page or in its own PDF. Where a number is quoted from secondary coverage because the original sits behind a paywall, we have said so at the point of use.
One example of why this matters. For the same learning management system market in the same base year, published estimates run from US$24.09 billion to US$31.42 billion depending on which firm you ask, with ten-year forecasts diverging by roughly half. Rather than pick one, we would suggest treating any single market-size number with care.
Every organisation whose data appears above, with a link to where it publishes it.
Compono measures culture, engagement and capability inside your organisation, so you can compare your people data against the market instead of guessing where you sit.
Talk to usThe four that change the most decisions: Australian job mobility has fallen four years running to 7.2%, global employee engagement is 20% with manager engagement down to 22%, Australian employers get 21.5 applicants per vacancy but judge only 5.2 suitable, and 89% of organisations using AI in HR report efficiency gains while only 24% report better identification of top candidates.
Australian employers who recently advertised reported 21.5 applicants per vacancy in the March quarter of 2026. Of those, 8.3 were considered qualified and 5.2 suitable. The national fill rate was 68.2%, so close to a third of advertised vacancies went unfilled. Source: Jobs and Skills Australia.
Gallup puts global engagement at 20% for 2025, the lowest since 2020. Australia and New Zealand sit at 21%, the United States at 31% and the United Kingdom at 10%. Other providers report much higher figures because they measure engagement differently, so always check which instrument a number comes from before comparing.
No credible source supports it. Every version of the claim traces back to a resume optimisation vendor that promoted it around 2012 and closed in 2013 without publishing any study. The real 75% in this area is that around 75% of United States employers use an applicant tracking system, from Harvard Business School and Accenture research. It was never a rejection rate.
It is reviewed and refreshed as major research releases land, and the last review date is shown at the top. Labour market figures change quarterly, so check the reference period on any statistic before using it.

Compono Hire helps you predict job-fit and team-fit using behavioural science, so you can shortlist with confidence.
Request a demoBuilt for mid-market hiring teams.

Voice-first coaching that adapts to your personality. Get actionable steps you can take this week.
Start freeBuilt by Compono. Not therapy — practical behaviour change.
1 min read
If you're researching 360 degree feedback software, you already know the basics. Multiple raters assess an individual. Anonymous surveys collect...

1 min read
Last reviewed August 2026
1 min read
A white paper by Compono - August 2025 What makes HR truly impactful? Compono surveyed 52 companies across Australia and New Zealand and found it is...